As we are nearing new year and the festive nature of the period if at its apex, it feels very apropos to offer up another present to you, Dear Reader.
As teased in the China Economic Outlook, if there was time left in the year I would also do an Asia outlook. Let’s see if I can do an ASEAN one later, but here comes the Developed Asia.
this post is free, but for a detailed discussion and investment implicaiotns do please subscribe to the full version of the Substack, I appreciate it. The more paying subscribers there are, the stronger the signal for me to dedicate time to this.
A reminder that there’s a special offer on at the moment, until January 7th. Act now to avoid disappointment.
As for now, I do happen to have some time to do a whirlwind tour of Asia. More specifically what is the market expecting of the bigger economies in Asia.
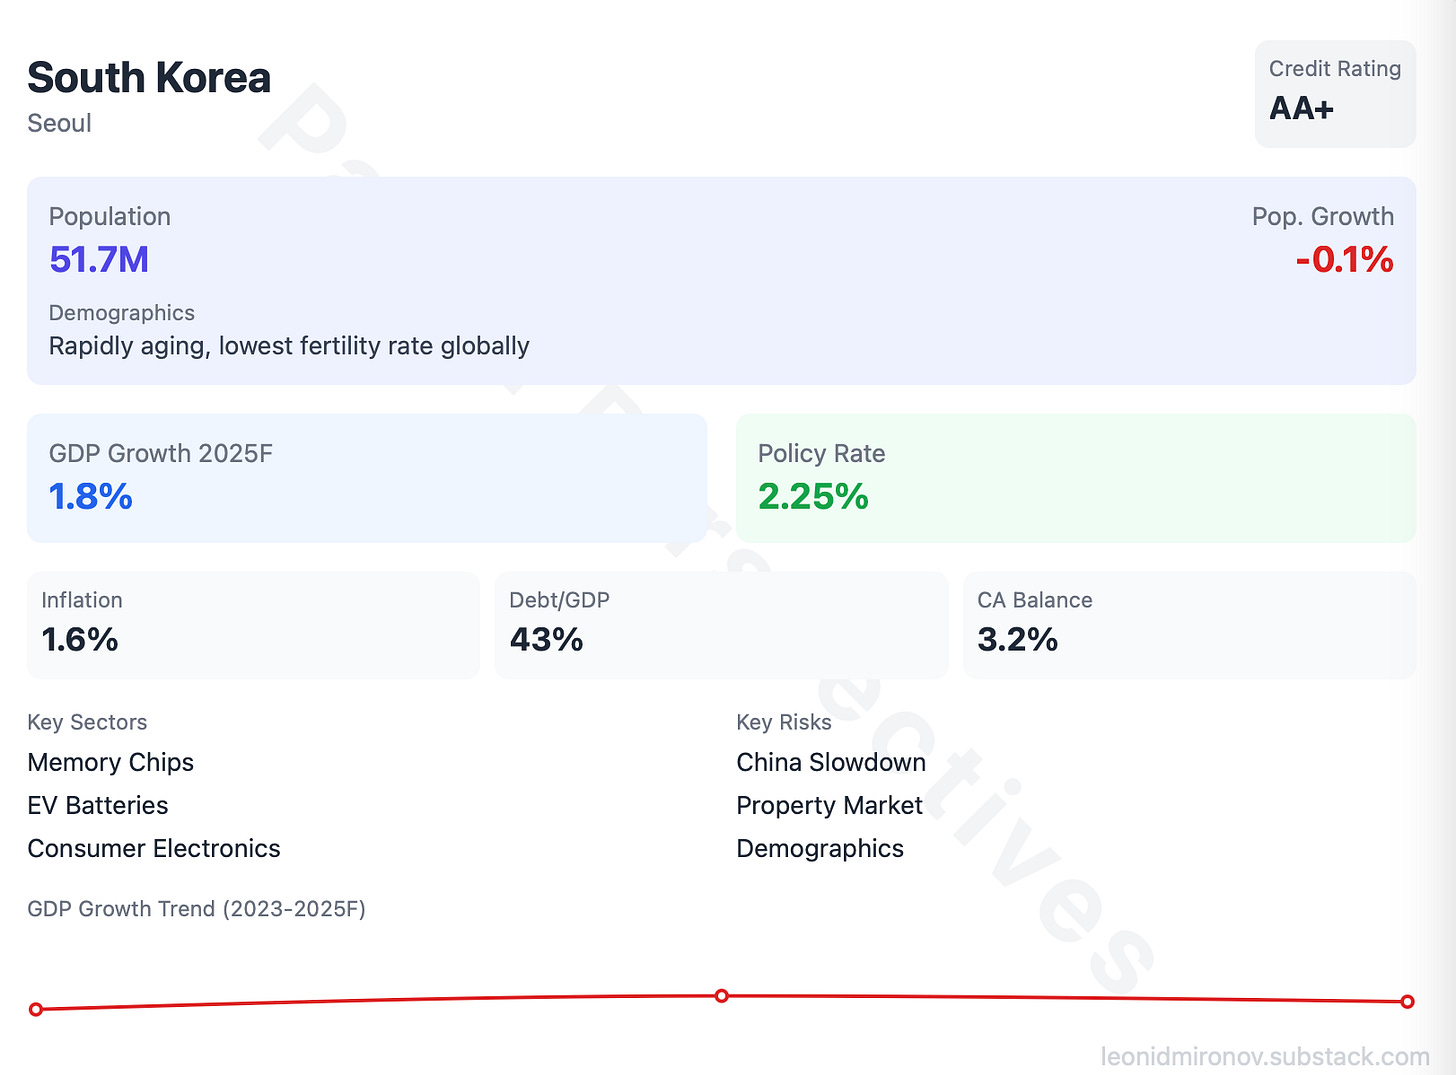
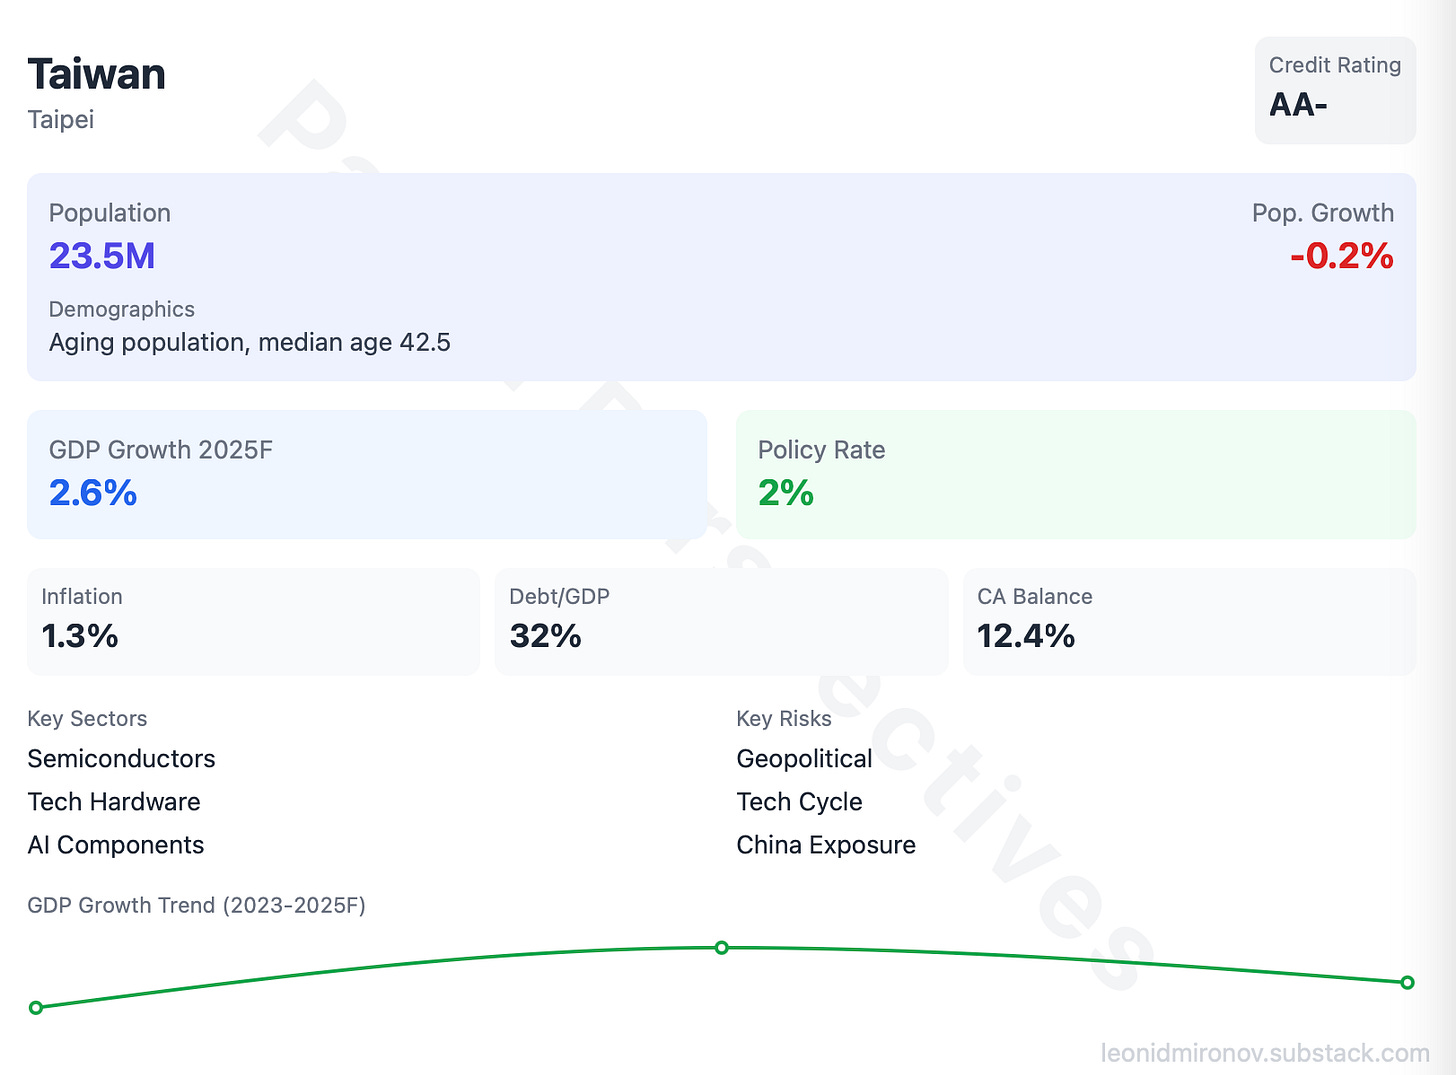
The developed Asia economies of Taiwan, South Korea, and Japan are navigating a complex economic environment in 2025. While global trade headwinds and geopolitical tensions persist, these nations demonstrate resilience through technological advancements, strategic policy measures, and adaptive economic structures. Taiwan is poised to lead regional growth at 2.6%, driven by AI-related demand and its dominance in semiconductors. South Korea follows with 1.8%, buoyed by a cyclical recovery in memory chips. Japan trails at 1.0%, reflecting steady policy normalisation and structural economic adjustments.
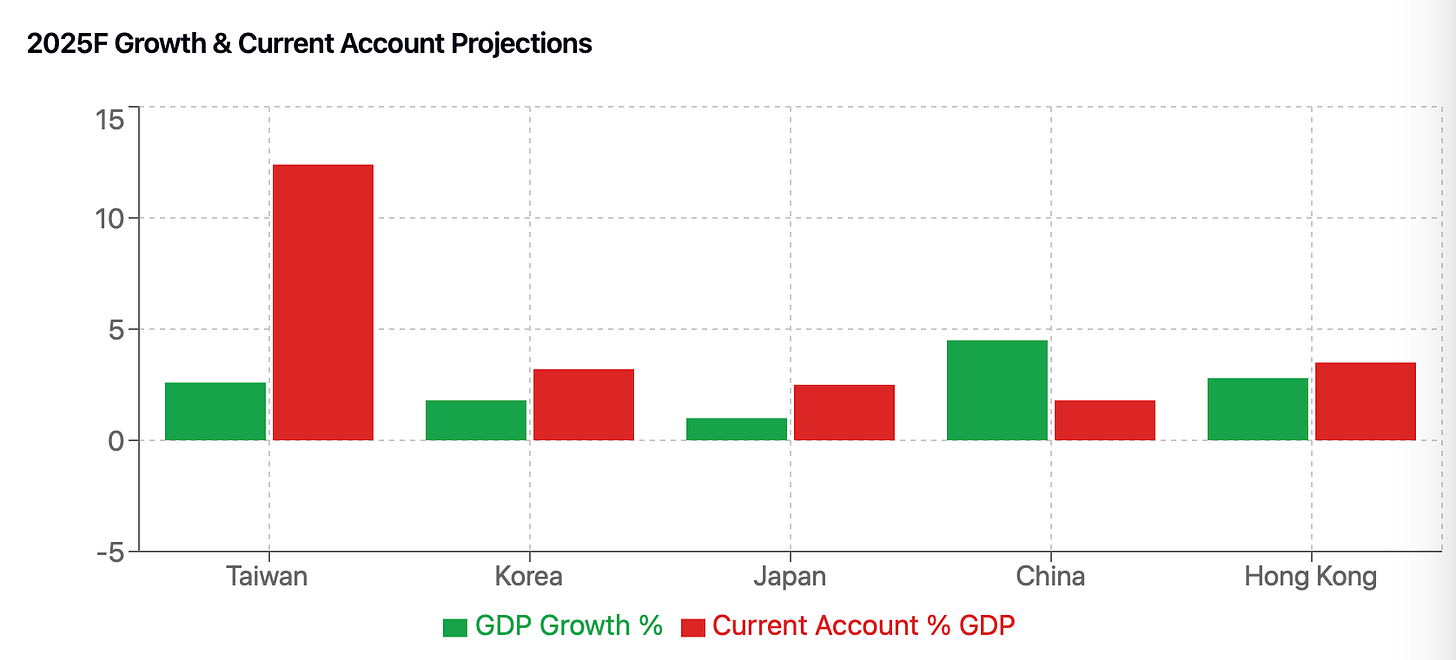
Developed Asia and Greater China offer distinct economic dynamics, with their trajectories shaped by structural priorities, trade dependencies, and sectoral competitiveness. Taiwan leads the growth projections among developed Asian economies with a forecasted GDP growth of 2.6% in 2025, supported by its dominance in advanced semiconductors and AI chip manufacturing. It also boasts a robust current account surplus of 12.4% of GDP, highlighting its export resilience. South Korea follows with a growth forecast of 1.8% and a current account surplus of 3.2%, driven by recovering demand in memory chips and expanding EV battery production. Japan’s growth is more modest at 1.0%, reflecting its demographic challenges, yet it maintains a steady current account surplus of 2.5%, underpinned by tourism recovery and investments in automation and green energy. In contrast, China’s slower yet higher-quality growth forecast of 4.5% emphasizes domestic consumption as the primary driver. Meanwhile, Hong Kong, with its economic growth steady yet heavily reliant on China, faces vulnerabilities due to its 55% export exposure to the mainland.
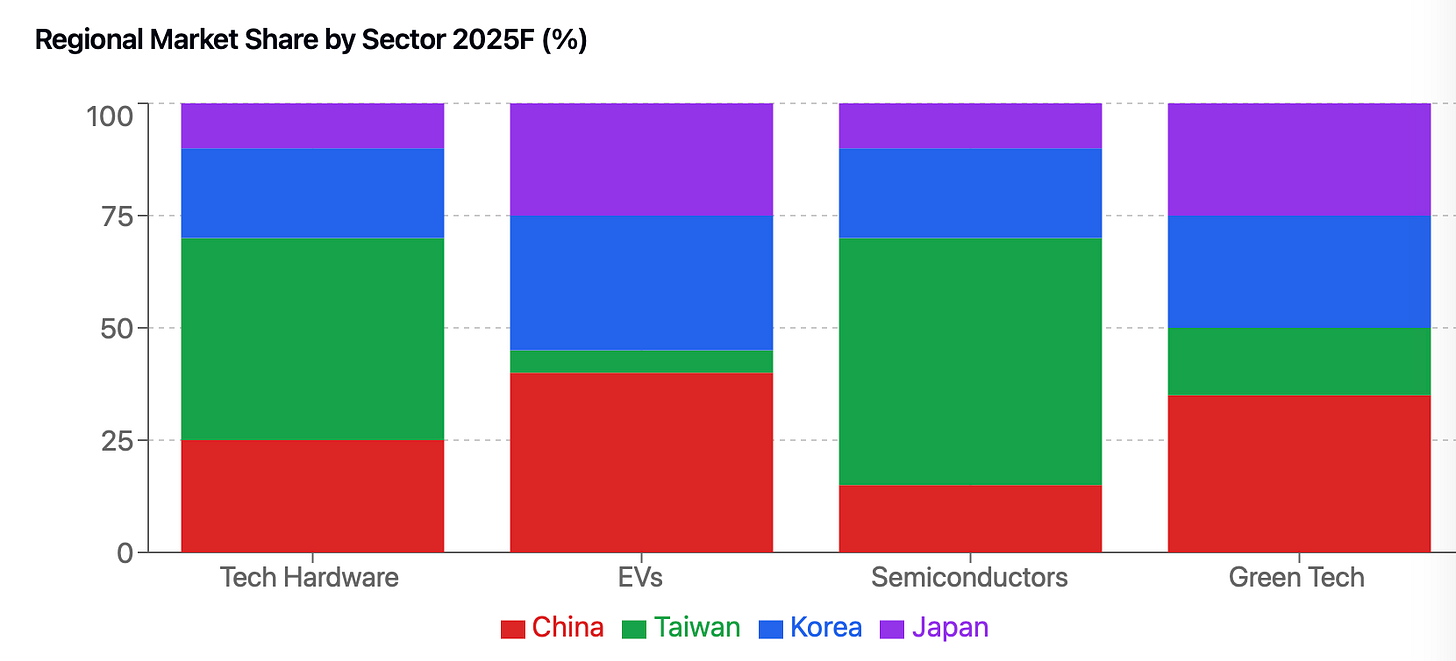
Sectoral market share projections for 2025 underline Taiwan’s technological dominance, particularly in semiconductors, where it controls over 60% of the global foundry market. Taiwan’s stronghold in advanced manufacturing nodes positions it as a critical player, while South Korea excels in DRAM and NAND memory technology. Japan plays a pivotal role in supplying critical materials and equipment for semiconductor manufacturing. However, China remains a competitive force, aggressively investing in semiconductor self-sufficiency, AI development, and EV supply chains. In the green technology sector, China leads with large-scale investments in renewables, though Japan and South Korea are leveraging their advanced materials and innovation to remain competitive. The EV sector is similarly dominated by China due to its integrated supply chains, while South Korea and Japan are making strategic inroads into the EV battery ecosystem.
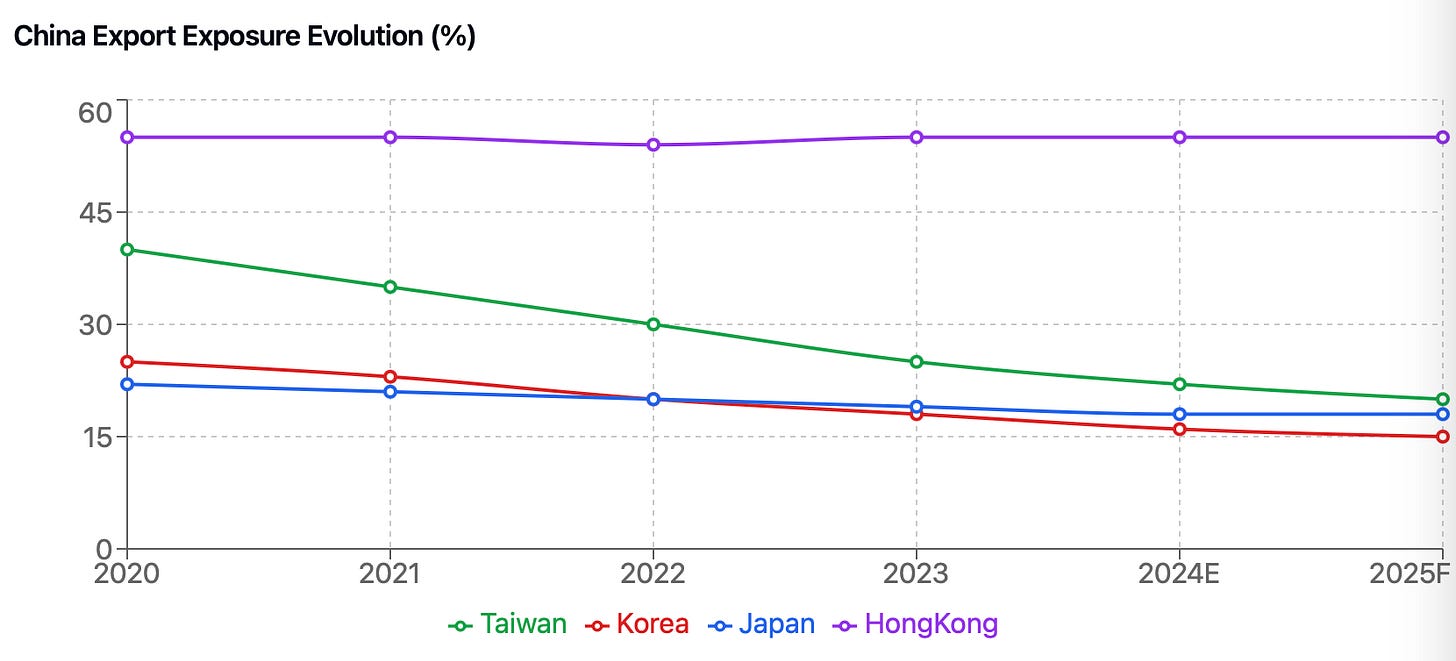
Export dependency on China has significantly declined across Developed Asia as supply chains diversify. Taiwan’s export exposure to China has fallen from 40% in 2020 to 20% in 2025, driven by a pivot toward the U.S. and ASEAN markets. South Korea and Japan have similarly reduced their dependencies, with South Korea’s exposure decreasing from 25% to 15% and Japan’s from 22% to 18% over the same period. By contrast, Hong Kong’s exposure remains stable at 55%, highlighting its continued role as a gateway for Chinese trade. These shifts reflect the broader adoption of the “China+1” strategy, with ASEAN emerging as the key beneficiary of production and trade realignment. Taiwan’s investments in U.S. and Japanese semiconductor production facilities further mitigate geopolitical risks, while Japan and South Korea continue expanding their presence in ASEAN markets.
The realignment of supply chains and the growing importance of the U.S. market have reshaped trade dynamics. The U.S. has become an increasingly vital trading partner for Taiwan, South Korea, and Japan, particularly for high-tech products like semiconductors and EV batteries. These economies are aligning their supply chains with the U.S. to secure long-term growth and reduce vulnerabilities associated with over-reliance on China. ASEAN also plays a crucial role as an alternative market, attracting investments and fostering trade diversification.
Developed Asia is leveraging technology leadership and trade diversification to maintain moderate but stable growth. Taiwan and South Korea excel in technology hardware and semiconductors, while Japan capitalizes on automation and green innovation. In contrast, Greater China’s transition to a consumption-led growth model faces challenges, particularly in the property sector and supply chain reconfiguration. For investors, Developed Asia presents opportunities in technology and green innovation, while Greater China offers selective potential in domestic consumption and green technologies, albeit with higher geopolitical and regulatory risks.
Currency Dynamics and FX Outlook
Japanese Yen (JPY)
The Japanese yen is forecasted to trade at ¥135-140/USD in 2025, reflecting gradual stabilization as the Bank of Japan (BOJ) pursues policy normalization. Key drivers of the yen’s performance include the BOJ’s gradual shift away from ultra-loose monetary policy, which narrows interest rate differentials with the U.S. Additionally, Japan’s improving current account position, supported by tourism recovery and stable export performance, adds to the yen’s underlying strength. While near-term volatility may persist, the yen has a long-term appreciation bias as policy normalisation progresses and global interest rate pressures ease.
Korean Won (KRW)
The Korean won is expected to trade at 1,250-1,300/USD in 2025. Near-term weakness is likely due to the Bank of Korea’s (BOK) aggressive easing cycle, which seeks to stimulate domestic consumption and support the housing market. Recovery in Korea’s tech sector, particularly memory chips and EV batteries, will provide medium-term support to the won. However, its trade and financial exposure to China introduce risks, as uncertainties in China’s economic trajectory could weigh on sentiment. Stabilisation is expected in the second half of 2025, as external demand improves and Korea’s export diversification efforts gain traction.
Taiwan Dollar (TWD)
The Taiwan dollar is projected to trade at 30-31/USD in 2025, making it the most resilient currency among regional peers. This reflects strong capital inflows into Taiwan’s tech sector, driven by its dominance in semiconductors and AI-related exports. Taiwan’s robust current account surplus of 12.4% of GDP further bolsters the currency’s stability. The Central Bank of the Republic of China’s (CBC) active intervention helps maintain exchange rate stability, mitigating short-term volatility. Taiwan’s positioning as a key player in the global technology supply chain reinforces the TWD’s strength.
Inflation and Monetary Policy Matrix
The inflation and monetary policy outlook varies across the region, reflecting differing economic conditions and central bank strategies:
Taiwan: Inflation is forecasted at 1.3% in 2025, supported by stable import costs and moderate wage growth. The CBC is expected to pursue a gradual rate-hiking cycle, maintaining a balance between controlling inflation and supporting growth in its tech-driven economy.
Korea: Inflation is expected at 1.6% in 2025, influenced by rising service costs and housing prices. The BOK’s aggressive rate cuts aim to stimulate domestic demand while offsetting external risks, such as trade exposure to China.
Japan: Inflation is forecasted at 1.6%, driven by higher energy costs and increased tourism-related spending. The BOJ’s normalization of monetary policy reflects its focus on stabilizing inflation while gradually aligning interest rates with global benchmarks.
Capital Flows
Taiwan: Strong capital inflows into Taiwan’s tech sector underline its strategic importance in the global semiconductor supply chain. Sustained foreign direct investment (FDI) supports the currency and bolsters external stability.
Korea: Portfolio flows into Korea remain sensitive to U.S. Federal Reserve policy. While rate differentials pose short-term challenges, recovery in tech and green industries is expected to attract medium-term investment.
Japan: Pension fund repatriation potential provides a steady source of capital inflows, reflecting Japan’s aging demographic and increasing domestic investment needs. Its improving current account position and policy normalization add further confidence to capital flows.
The currency and balance of payments dynamics illustrate diverse economic drivers across Developed Asia. Taiwan’s TWD stands out for its resilience, driven by its robust tech sector and strong current account surplus. The KRW faces short-term weakness but benefits from recovery in key sectors and export diversification, while the JPY is positioned for long-term appreciation as policy normalization unfolds. Inflation and monetary policy approaches highlight Taiwan’s gradualist stance, Korea’s aggressive easing, and Japan’s steady normalization. These trends underscore the importance of understanding each market’s macroeconomic and policy nuances when crafting investment strategies.
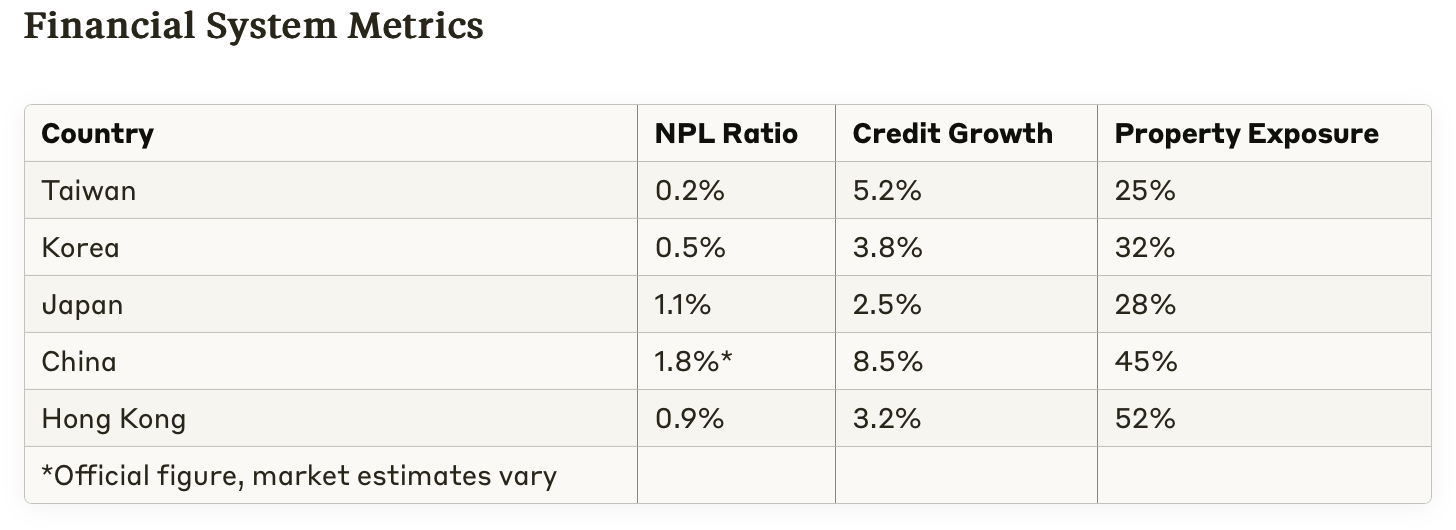
The financial metrics highlight significant differences in the resilience of the banking and credit systems across Developed Asia and Greater China. Taiwan leads in financial stability with a low non-performing loan (NPL) ratio of 0.2%, robust credit growth of 5.2%, and moderate property exposure at 25%. This reflects a strong and disciplined financial framework, making Taiwan less susceptible to shocks in the property market or bad loans.
South Korea’s financial system is stable, with an NPL ratio of 0.5% and credit growth at 3.8%. However, its property exposure is higher at 32%, indicating greater vulnerability to fluctuations in real estate prices. Japan has the highest NPL ratio among Developed Asia economies at 1.1%, reflecting lingering challenges in its banking sector, while credit growth is the slowest at 2.5%. Japan’s relatively low property exposure (28%) mitigates some of the risks.
China stands out with an NPL ratio of 1.8%, which is significantly higher than regional peers and underscores the stresses in its financial system, particularly tied to the property sector, where exposure reaches 45%. Despite this, credit growth is robust at 8.5%, driven by ongoing policy efforts to stimulate the economy. Hong Kong faces notable risks with a relatively high NPL ratio of 0.9% and significant property exposure at 52%, the highest among all economies, reflecting its heavy reliance on real estate.
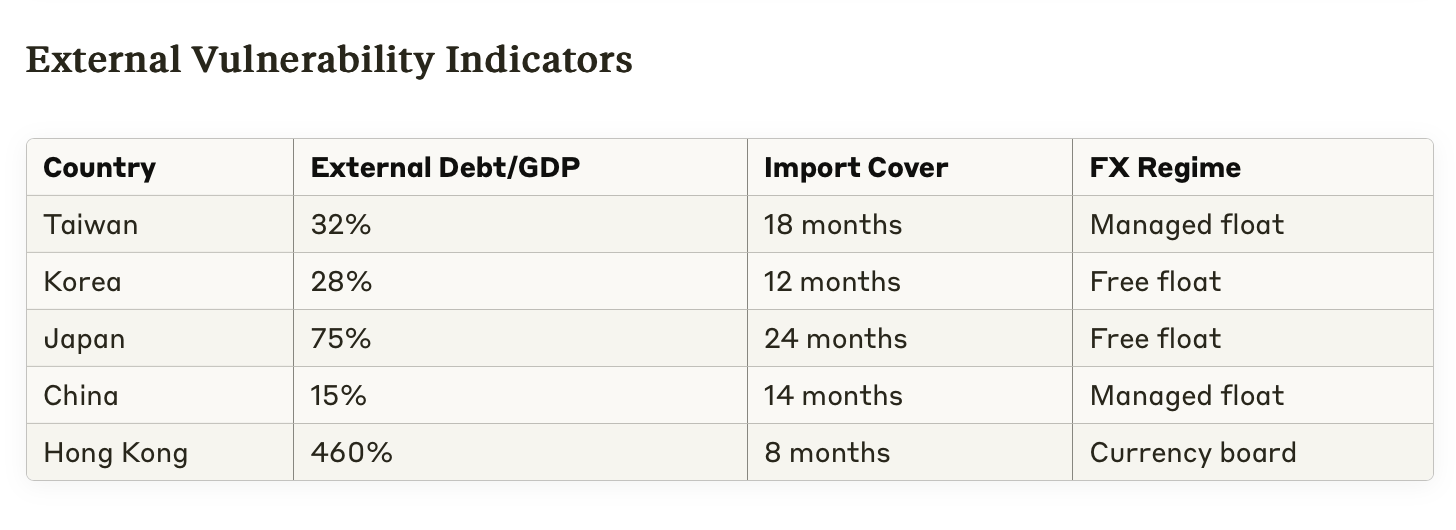
The external vulnerability metrics provide further insights into the stability and risk exposure of these economies. Taiwan and Japan display strong external resilience, with Taiwan’s external debt-to-GDP ratio at 32% and 18 months of import cover, while Japan has the highest import cover in the group at 24 months despite a high external debt-to-GDP ratio of 75%. Taiwan’s managed float currency regime provides additional stability, enabling it to manage trade and capital flows effectively.
South Korea balances a low external debt-to-GDP ratio of 28% with 12 months of import cover, reflecting its robust trade position. The free float currency regime allows flexibility in absorbing external shocks. Japan’s free float currency regime supports its high import cover but exposes it to volatility in global markets.
China has the lowest external debt-to-GDP ratio at 15%, supported by its managed float FX regime and moderate import cover of 14 months. This provides some buffer against external shocks but is offset by internal financial vulnerabilities, particularly in the property sector. Hong Kong, with an external debt-to-GDP ratio of 460%, is highly leveraged and has limited import cover of just 8 months. Its currency board system, pegged to the U.S. dollar, further restricts flexibility in managing external shocks, making it highly exposed to global economic fluctuations and capital outflows.
The financial and external indicators paint a clear picture of varying degrees of resilience across the economies. Taiwan emerges as the most stable, with low financial risks and solid external buffers, followed closely by South Korea, which combines strong trade dynamics with manageable financial exposure. Japan’s high external debt and slower credit growth are offset by strong import cover and low property risks. Greater China faces significant challenges, with China’s property sector posing systemic risks despite strong credit growth, while Hong Kong’s heavy reliance on real estate and external leverage make it highly vulnerable to global shocks. These metrics underline the importance of targeted policy responses and diversification strategies for sustaining financial stability in these economies.
Stock Markets
The valuation metrics across the Developed Asia and Greater China markets highlight key differences in equity attractiveness:
Taiwan: With a P/E ratio of 14.5x and an EV/EBITDA of 8.5x, Taiwan is valued at a premium compared to its peers. The high dividend yield of 3.5% and a price/book (P/B) ratio of 2.2x reflect investor confidence in its robust technology sector, particularly semiconductors and AI chip production. Taiwan’s valuation captures its strong position in the global supply chain and growth potential in advanced manufacturing.
South Korea: South Korea trades at a P/E of 12.0x and EV/EBITDA of 7.0x, with a moderate dividend yield of 2.8% and a P/B ratio of 1.1x, reflecting its relative undervaluation. This is partly due to its significant trade exposure to China and cyclical challenges in the memory chip sector. However, its competitive position in EV batteries and green technology provides long-term growth opportunities.
Japan: With the highest P/E ratio at 15.5x and an EV/EBITDA of 9.0x, Japan reflects a policy normalization premium. A dividend yield of 2.5% and a P/B ratio of 1.4x indicate steady investor interest, driven by its leadership in automation, robotics, and renewable energy. Japan’s valuation aligns with its structural reforms and stable economic outlook.
China: At 10.5x P/E and 6.8x EV/EBITDA, China is the most undervalued market, reflecting investor concerns over growth, policy uncertainty, and property sector risks. A relatively high dividend yield of 3.2% and a P/B ratio of 1.3x suggest value opportunities, particularly in sectors like green technology and domestic consumption.
Hong Kong: With a P/E of 11.8x and EV/EBITDA of 7.5x, Hong Kong trades at a discount due to its reliance on China’s economic trajectory and elevated property sector risks. The highest dividend yield of 3.8% provides a degree of income stability, but a low P/B ratio of 1.0x highlights investor caution.
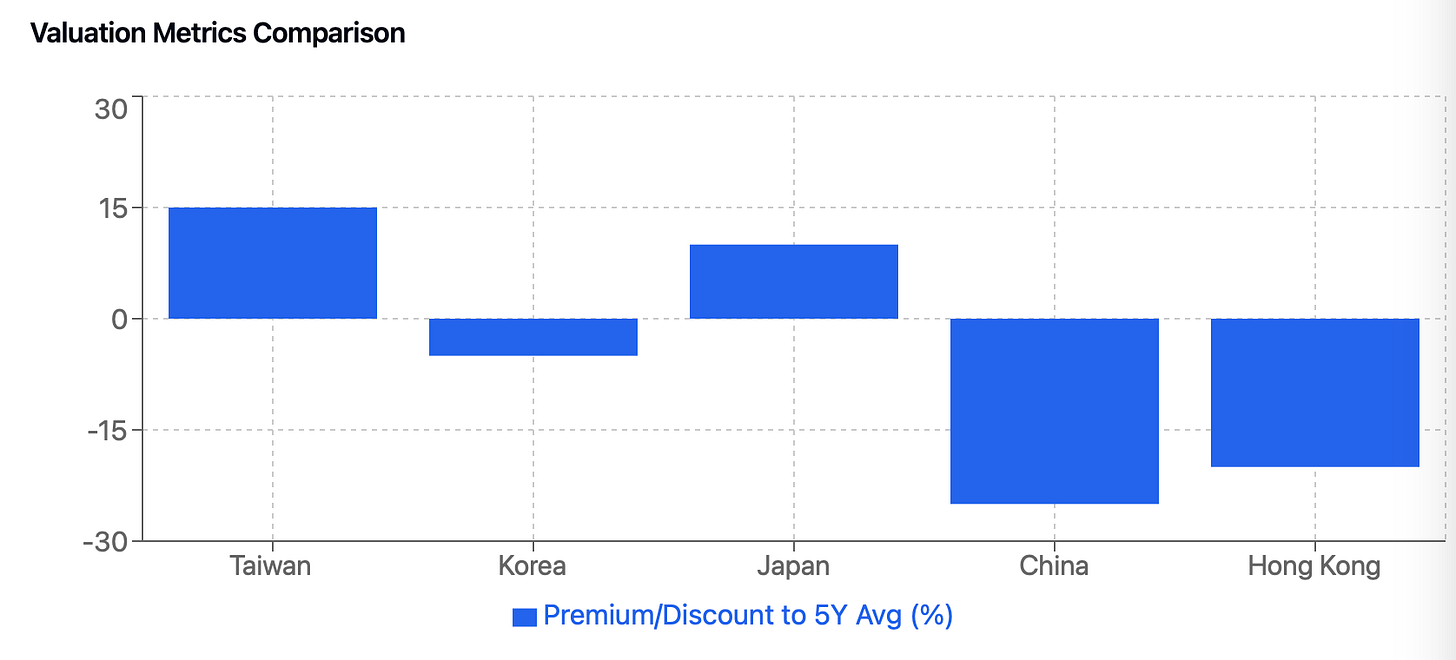
Valuation Premiums/Discounts vs. 5-Year Averages
The deviations from historical averages provide insights into investor sentiment and market dynamics:
Taiwan: Trading at a 15% premium to its 5-year average P/E, Taiwan reflects the ongoing AI and semiconductor cycle, which supports strong earnings growth and investor optimism. The premium highlights its strategic role in the global technology supply chain and its ability to leverage new growth opportunities.
South Korea: Valued at a 5% discount, South Korea’s underperformance is tied to its exposure to China and the cyclical downturn in the memory chip market. The discount reflects market caution but also presents a potential entry point for investors focusing on its long-term growth sectors, such as EV batteries and green technology.
Japan: At a 10% premium, Japan benefits from positive sentiment driven by policy normalization and structural reforms. The premium underscores investor confidence in its leadership in automation and robotics, which positions it as a stable, long-term growth market.
China: Trading at a 25% discount, China reflects deep investor concerns over slowing growth, property market instability, and regulatory uncertainty. While the valuation presents a contrarian opportunity, the discount suggests that risks remain elevated and investor sentiment is subdued.
Hong Kong: At a 20% discount, Hong Kong’s valuation reflects property sector concerns and its heavy reliance on China’s economic outlook. The discount aligns with uncertainties in the broader Chinese market and challenges in maintaining its role as a global financial hub.
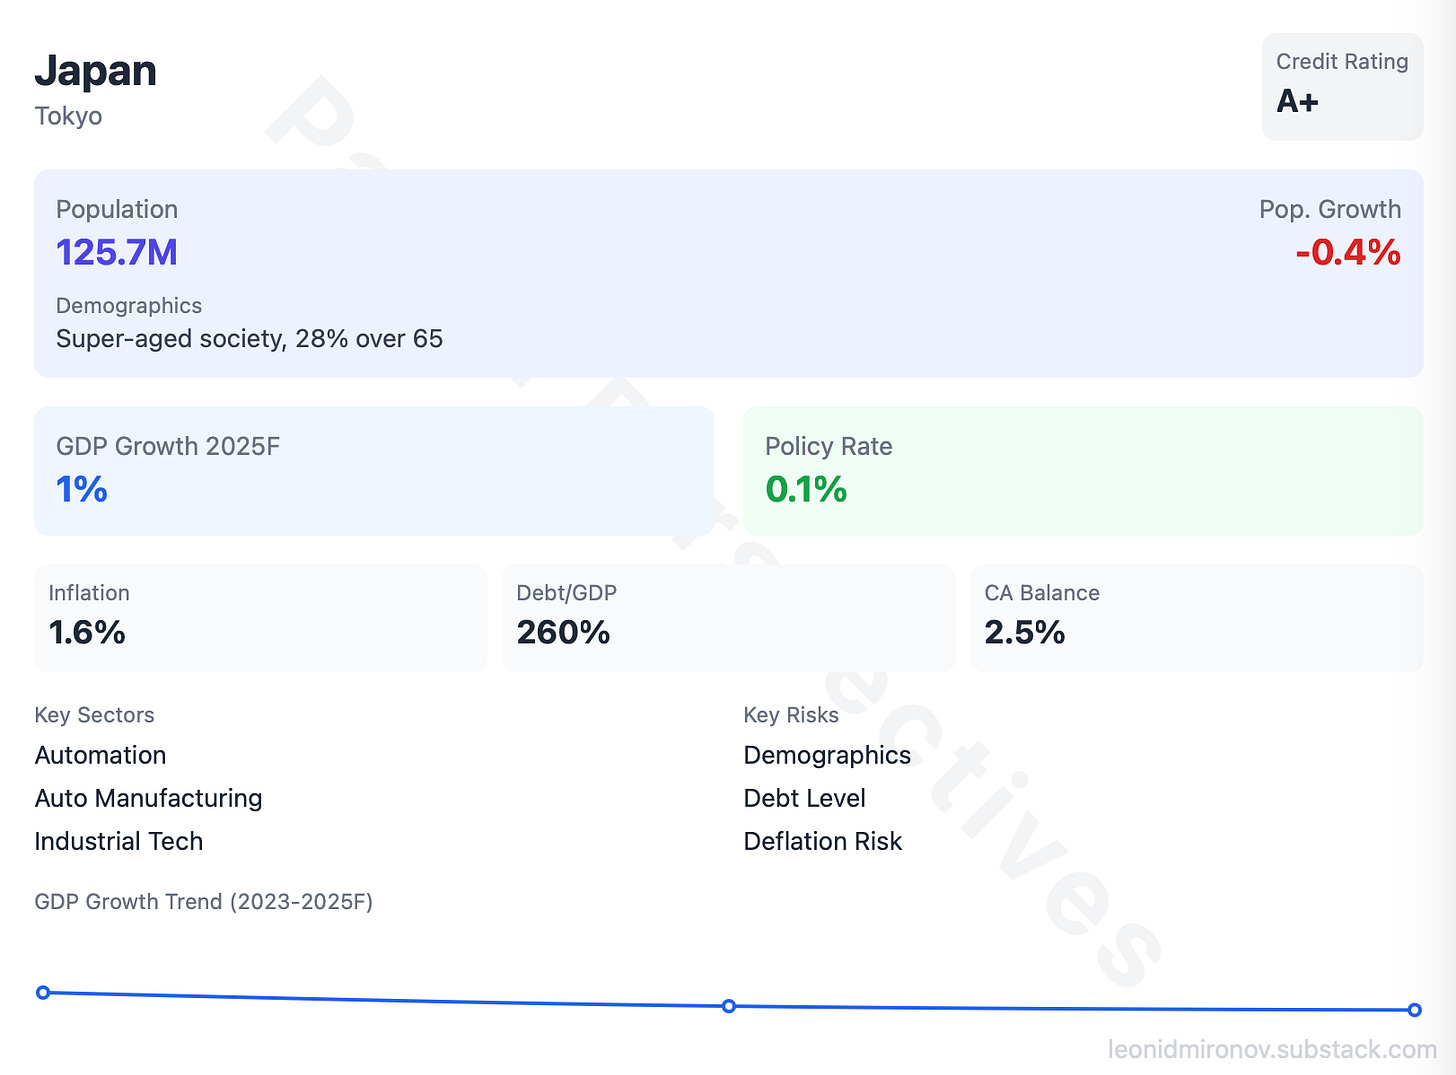
I’ve also compiled my “cheat sheets” for teh Developed Asia. What i’m looking for and what the moving parts are. I will start with my home for a few years of Graduate studies, the land of Rising Sun; Japan.
Japan: Policy-Driven Stability
Japan’s 2025 outlook underscores a delicate balance between policy-driven growth and structural challenges. Investments in automation, gradual monetary normalization, and fiscal support for green technology provide pathways for stability. However, demographic constraints and weak domestic demand highlight the urgency for wage growth and immigration reforms. Japan remains a compelling case for targeted investments in automation, green energy, and tourism sectors, with incremental improvements anticipated through 2025.
2025 Growth Forecast: 1.0%
Baseline: Japan’s economic growth is expected to be modest at 1.0% in 2025, reflecting a stable, albeit slow, recovery from structural constraints and global uncertainties.
Context: Growth is underpinned by ongoing structural reforms, a gradual reopening of tourism, and supportive fiscal and monetary policies. However, demographic challenges and weak domestic demand cap upside potential.
Key Drivers
Structural Reforms: Investments in Automation and Robotics
Rationale: Japan’s aging population and shrinking labor force necessitate investments in automation to sustain productivity and industrial output.
Current State:
Japan’s working-age population has been declining at a rate of 0.9% annually, prompting businesses to adopt automation at a faster pace. Labor shortages are particularly acute in manufacturing, logistics, and healthcare.
Data:
In 2024, industrial robots per 10,000 manufacturing workers in Japan reached 399 units, surpassing Germany and Korea.
Government-backed programs like the “Society 5.0” initiative aim to integrate advanced technologies into industries, allocating ¥2 trillion (approximately $14 billion) to robotics and AI development in 2025 .
Expected Impact:
Productivity gains are expected to offset labor constraints, contributing approximately 0.3 percentage points to GDP growth in 2025.
Tourism Recovery
Rationale: Tourism, a key component of Japan’s service economy, is gradually rebounding as international travel resumes post-pandemic.
Current Trends:
Japan saw 25 million inbound tourists in 2024, up from 20 million in 2023 but still below the pre-COVID level of 31 million in 2019.
Spending per tourist in 2024 averaged ¥135,000 ($1,200), 15% lower than in 2019, due to cautious consumer behavior and weaker currencies of key visitor countries.
Data:
Tourism’s contribution to GDP is expected to rise to 1.3% in 2025 (from 1.0% in 2024).
Key sources: Increased arrivals from Southeast Asia and the U.S., supported by relaxed visa policies and marketing campaigns .
Expected Impact:
The tourism recovery is projected to add 0.2 percentage points to GDP growth, particularly benefiting retail, hospitality, and regional economies.
Challenges
Wage Growth Remains Critical
Rationale: Sustained wage growth is vital to boosting consumer spending and achieving the Bank of Japan’s 2% inflation target.
Current State:
Wage growth in 2024 averaged 2.2%, short of the 3% threshold deemed necessary to drive stable inflation.
Large corporations have shown moderate wage increases, but small and medium enterprises (SMEs), which account for 70% of employment, struggle to match these increases.
Data:
Household spending fell 0.7% year-on-year in the first three quarters of 2024, reflecting wage stagnation and cautious consumer behavior.
Real disposable income remains flat due to rising energy costs and modest nominal wage growth .
Policy Implications:
The government is incentivising corporate wage hikes through tax deductions and subsidies. However, broader gains remain uncertain.
Persistent Demographic Pressures and Weak Domestic Demand
Rationale: Japan’s demographic decline directly impacts labor supply, consumer spending, and overall economic dynamism.
Current Trends:
The population fell by 0.7% in 2024, with the working-age cohort (15-64 years) shrinking to 59% of the total population.
Weak domestic demand continues to drag GDP, with private consumption contributing just 0.4 percentage points in 2024.
Data:
Retail sales growth slowed to 1.1% year-on-year in 2024, compared to 2.5% in 2023.
Healthcare and pension spending now account for over 33% of the government budget .
Policy Implications:
Demographic headwinds reinforce the need for immigration reforms and productivity enhancements through automation and innovation.
Policy Insights
Monetary Policy: Gradual Normalisation
Rationale: The Bank of Japan is expected to continue its cautious normalization, balancing the need for price stability with support for growth.
Current State:
Policy rates remain at -0.1% (short-term) and 0% (long-term), with yield curve control keeping 10-year bonds within a 0.5% range.
Inflation stood at 1.6% in 2024, driven by energy prices and supply chain constraints.
Expected Adjustments:
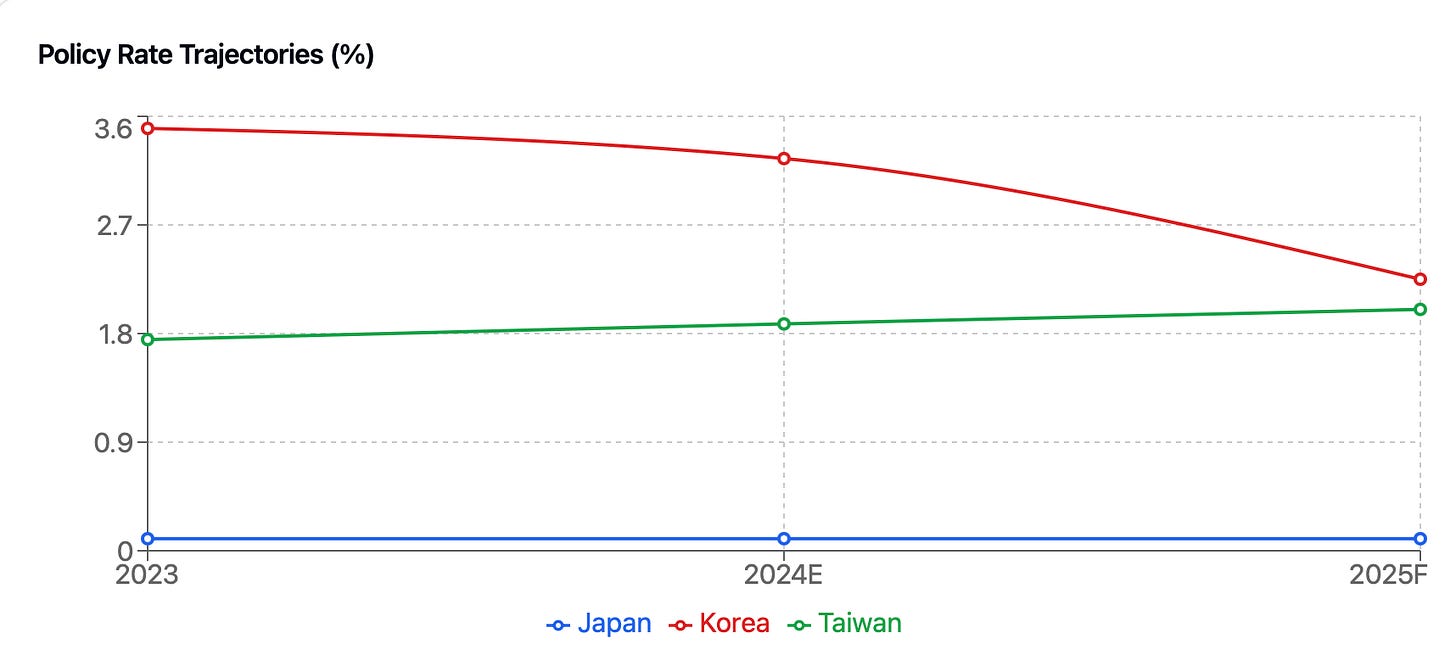
Policy rates are projected to rise to 0.1% by late 2025, contingent on stable inflation and wage growth .
Impact:
Normalization is expected to strengthen the yen (forecast: ¥135–140/USD), improving purchasing power and reducing import costs.
Fiscal Measures: Increased Spending on Green Technology and Infrastructure
Rationale: Fiscal policies will focus on stimulating growth through infrastructure and green energy investments.
Current Measures:
The government has allocated ¥4.5 trillion ($31 billion) for renewable energy projects, aiming for 50 GW of offshore wind capacity by 2030.
Infrastructure spending includes ¥3 trillion ($21 billion) for upgrading regional transportation and disaster resilience .
Impact:
These initiatives are expected to create 500,000 jobs and contribute 0.5 percentage points to GDP growth over the medium term.
South Korea: Navigating Cyclical Recovery and Structural Challenges
South Korea’s 2025 outlook reflects a delicate balance of cyclical recovery and structural challenges. The recovery in the memory chip sector, supported by AI-driven demand, provides a critical growth lever. However, high dependency on China and demographic headwinds underscore the need for diversification and reform. Strategic investments in green energy, infrastructure, and technology, combined with aggressive monetary easing, position South Korea for cautious optimism. Investors should focus on high-growth sectors like semiconductors, EV batteries, and green technology, while remaining mindful of geopolitical and macroeconomic risks.
2025 Growth Forecast: 1.8%
Baseline: South Korea’s economic growth is expected to moderate to 1.8% in 2025, reflecting subdued external demand, geopolitical tensions, and structural demographic constraints.
Context: The recovery in memory chips, easing credit conditions, and targeted government support provide some momentum. However, high exposure to China and an aging population continue to weigh on growth prospects.
Key Drivers
Tech Sector Revival
Rationale: The memory chip industry, a cornerstone of South Korea’s economy, is poised for a cyclical recovery in 2025, driven by AI-related demand and a global tech rebound.
Current State:
DRAM and NAND prices, which declined sharply in 2024, are projected to stabilize and recover by mid-2025.
The government is investing heavily in next-generation semiconductors and AI applications, allocating ₩1.3 trillion ($1 billion) for R&D in 2025.
Data:
Semiconductor exports accounted for 16% of total exports in 2024 but contracted by 18% year-on-year due to weak global demand. A 5% recovery is projected for 2025.
South Korea’s share of global semiconductor production remains at 20%, second only to Taiwan.
Expected Impact:
The tech sector recovery is expected to contribute 0.5 percentage points to GDP growth, with benefits extending to related industries like advanced packaging and display technologies.
Domestic Consumption Recovery
Rationale: Household spending is gradually recovering from a low base, supported by easing credit conditions and government subsidies.
Current Trends:
Consumer confidence rebounded slightly in Q4 2024, following a series of interest rate cuts by the Bank of Korea.
The government has implemented targeted support for low-income households, including energy subsidies and childcare allowances.
Data:
Retail sales grew 2.3% year-on-year in 2024 and are forecasted to accelerate to 3.5% in 2025.
Private consumption contributed 0.7 percentage points to GDP in 2024 and is expected to rise to 0.9 percentage points in 2025.
Expected Impact:
Improved domestic spending could offset some of the drag from weak exports, providing a more balanced growth composition.
Challenges
High Exposure to China
Rationale: South Korea’s trade and investment ties with China leave it vulnerable to China’s economic slowdown and trade tensions with the U.S.
Current State:
China accounts for 24% of South Korea’s exports, down from 30% in 2018, reflecting supply chain diversification.
Key sectors like chemicals, machinery, and intermediate goods face declining demand from Chinese industries.
Data:
Exports to China contracted by 12% in 2024, with only a modest 2% recovery expected in 2025.
Indirect exposure to China through third-country supply chains remains significant at 10% of GDP.
Policy Implications:
The government is encouraging firms to diversify export markets, with ASEAN and India emerging as priority regions.
Demographic Constraints
Rationale: An aging population and low birth rates are exacerbating labor shortages and weakening domestic demand.
Current Trends:
South Korea’s fertility rate hit a record low of 0.7 in 2024, the lowest among OECD countries.
The working-age population is projected to shrink by 0.8% annually over the next decade.
Data:
Labor force participation for individuals aged 60+ rose to 38% in 2024, as retirees re-enter the workforce to compensate for income gaps.
Social welfare spending accounted for 13% of GDP in 2024, up from 10% a decade ago.
Policy Implications:
Immigration reforms and automation are critical to addressing labor shortages and sustaining productivity.
Policy Insights
Monetary Policy: Aggressive Easing
Rationale: The Bank of Korea (BOK) is expected to continue its rate-cutting cycle to support growth and stabilize housing markets.
Current State:
Policy rates were reduced from 3.50% to 2.75% in 2024, with further cuts to 2.25% anticipated by late 2025.
Inflation is forecasted to moderate to 1.6% in 2025, providing room for additional monetary easing.
Impact:
Lower rates are expected to boost credit availability, particularly for SMEs and households, and reduce pressure on mortgage holders.
Fiscal Policy: Targeted Interventions
Rationale: Fiscal measures will focus on infrastructure, green energy, and support for strategic industries like semiconductors and EV batteries.
Current Measures:
The government announced a ₩20 trillion ($15 billion) infrastructure plan for 2025, emphasizing smart cities and renewable energy.
Subsidies for EV battery production are expected to total ₩3 trillion ($2.3 billion), aligning with global decarbonization efforts.
Impact:
These measures are projected to add 0.4 percentage points to GDP growth while enhancing the country’s long-term competitiveness.
Taiwan: Tech-Led Resilience Amid Geopolitical Challenges
Taiwan’s 2025 outlook highlights a robust economic trajectory driven by its leadership in semiconductors and strategic investments in technology and renewable energy. While geopolitical tensions and energy security challenges pose risks, proactive policies and strong domestic demand provide resilience. Investors should focus on Taiwan’s advanced manufacturing, AI, and green energy sectors, which are well-positioned for growth amid global economic uncertainties.
2025 Growth Forecast: 2.6%
Baseline: Taiwan is poised to lead developed Asia in economic growth, with a 2025 forecast of 2.6%, underpinned by its global dominance in semiconductors and robust demand for AI-related technologies.
Context: Despite challenges such as geopolitical tensions and global trade realignments, Taiwan’s investments in advanced manufacturing and diversified trade partnerships provide a solid foundation for growth.
Key Drivers
Semiconductor Leadership
Rationale: Taiwan continues to dominate the global semiconductor industry, accounting for over 60% of global foundry market share. The industry’s resilience ensures sustained export demand and capital investment.
Current State:
Investments in advanced nodes (3nm and beyond) remain a priority, with capital expenditures by Taiwan Semiconductor Manufacturing Company (TSMC) expected to exceed $36 billion in 2025.
AI-related demand for high-performance computing chips drives export growth, particularly from the U.S.
Data:
Semiconductor exports grew by 8% year-on-year in 2024, and a similar growth rate is projected for 2025.
The U.S. accounts for 35% of Taiwan’s semiconductor exports, reflecting strong bilateral trade ties .
Expected Impact:
The tech sector is expected to contribute 1.2 percentage points to GDP growth in 2025, supported by global demand for advanced chips.
Domestic Demand
Rationale: Stable employment, moderate wage growth, and targeted fiscal measures underpin domestic consumption, which serves as a secondary growth driver.
Current Trends:
The labor market remains strong, with unemployment projected to stay at a low 3.5%.
Government incentives, such as tax cuts and subsidies for electric vehicles and green energy adoption, support household spending.
Data:
Retail sales increased by 4.1% in 2024 and are forecasted to grow by 4.5% in 2025.
Wage growth is expected to remain stable at 4%, supporting consumer confidence .
Expected Impact:
Private consumption is projected to contribute 0.7 percentage points to GDP growth, offsetting external trade volatility.
Challenges
Geopolitical Tensions
Rationale: Taiwan’s strategic position in the U.S.-China rivalry creates both risks and opportunities. Geopolitical uncertainty could disrupt supply chains and impact foreign investment.
Current State:
Cross-strait tensions have escalated, with increasing military activity in the Taiwan Strait.
U.S. export controls on semiconductor technologies further complicate trade dynamics with China.
Data:
Exports to China accounted for 20% of Taiwan’s total in 2024, down from 40% in 2020, as companies diversify supply chains.
The government allocated $1 billion in 2025 to strengthen cybersecurity and critical infrastructure .
Policy Implications:
Taiwan is intensifying partnerships with the U.S., Japan, and ASEAN to mitigate risks associated with China.
Energy Security
Rationale: Taiwan’s high dependence on imported energy poses risks to economic stability amid global energy price volatility and geopolitical disruptions.
Current State:
Approximately 97% of Taiwan’s energy is imported, with fossil fuels accounting for 75% of the energy mix.
Efforts to expand renewable energy capacity, particularly offshore wind, are underway but face delays.
Data:
Renewable energy accounted for 8% of the energy mix in 2024, with a target of 20% by 2025.
Taiwan’s government has allocated NT$200 billion ($6.4 billion) for renewable energy projects in 2025 .
Policy Implications:
The focus on energy diversification and grid modernization is critical to enhancing long-term energy security.
Policy Insights
Monetary Policy: Moderate Tightening
Rationale: The Central Bank of the Republic of China (Taiwan) is expected to maintain a balanced stance, ensuring low inflation while supporting growth.
Current State:
Inflation was 1.5% in 2024 and is forecasted to moderate to 1.3% in 2025.
Policy rates were raised slightly in 2024 to 1.75%, with a further increase to 2.00% anticipated in 2025.
Impact:
Stable monetary policy supports investment in high-tech industries while keeping inflationary pressures in check.
Fiscal Policy: Strategic Investments
Rationale: The government is prioritizing spending on renewable energy, advanced manufacturing, and digital infrastructure to support sustainable growth.
Current Measures:
NT$300 billion ($9.6 billion) has been earmarked for semiconductor R&D and talent development in 2025.
Tax incentives for green energy adoption are expected to increase EV penetration to 10% of total vehicle sales by 2025 .
Impact:
These measures are projected to add 0.6 percentage points to GDP growth while bolstering long-term competitiveness.


